Minneapolis
Web Design Agency
Speed Report.
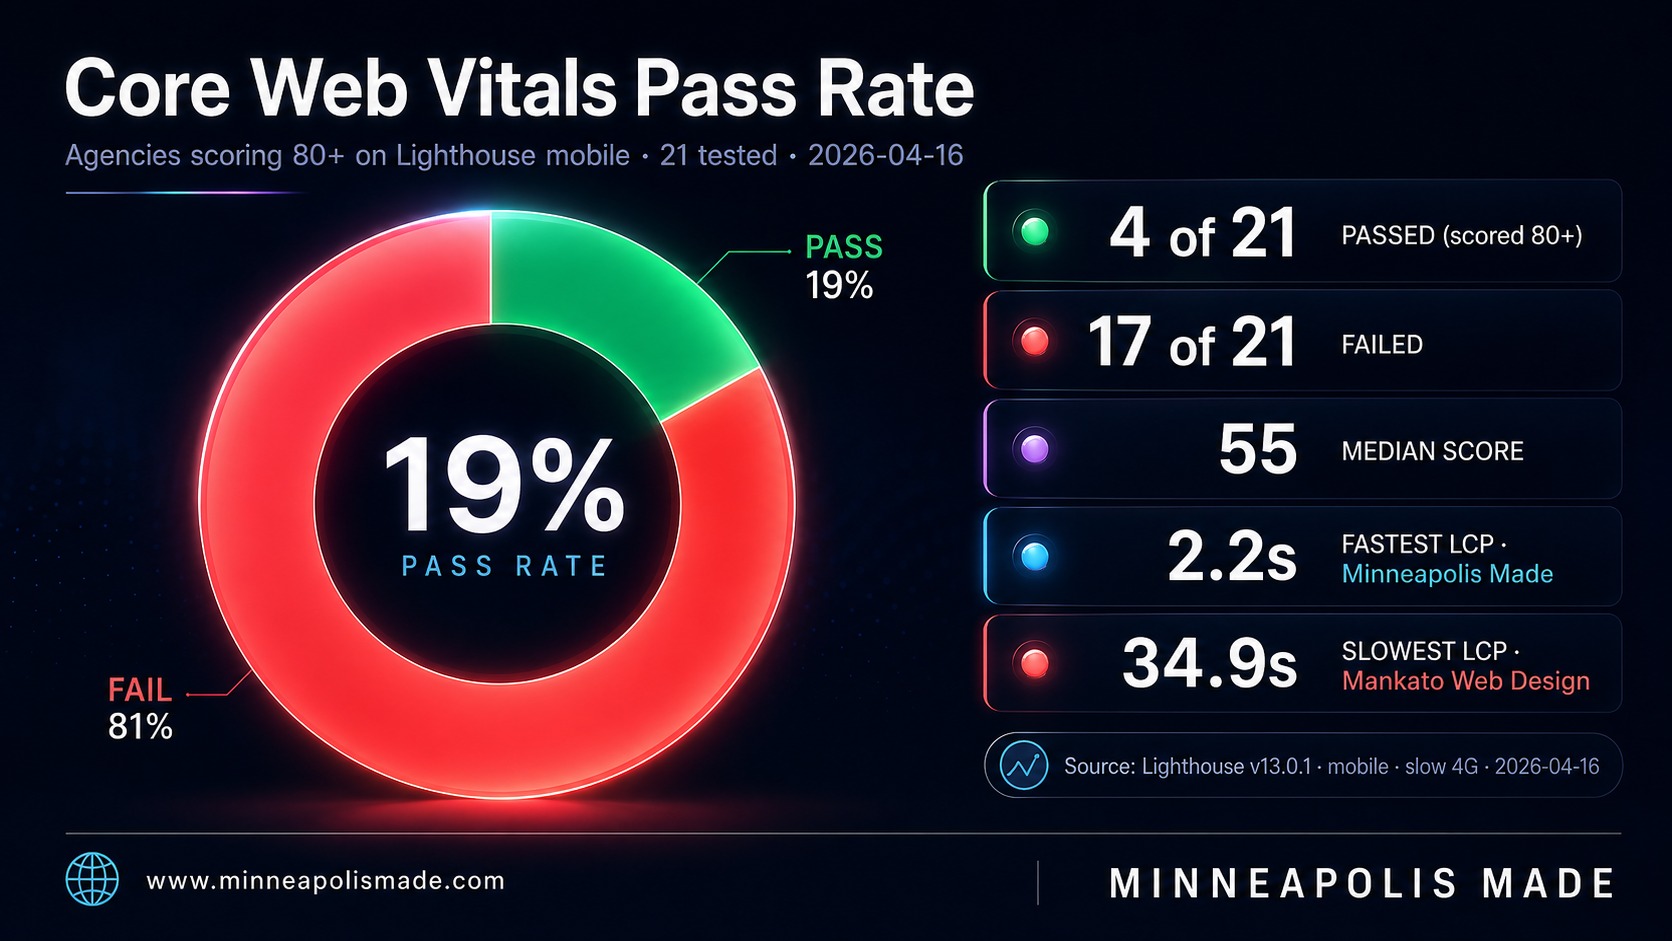
We tested 21 Minneapolis web design agencies on Lighthouse mobile. Only 4 passed. The median score was 55. The worst performer came in at 20. Every agency, every score, every excuse.

Most Minneapolis agencies lose this customer before their site even loads.
17 of 21 agencies fail Core Web Vitals
Every agency tested with Lighthouse v13.0.1 on mobile (emulated Moto G Power, slow 4G throttling) and desktop. Data captured April 16, 2026. Median score reported per site. Raw dataset available on request.
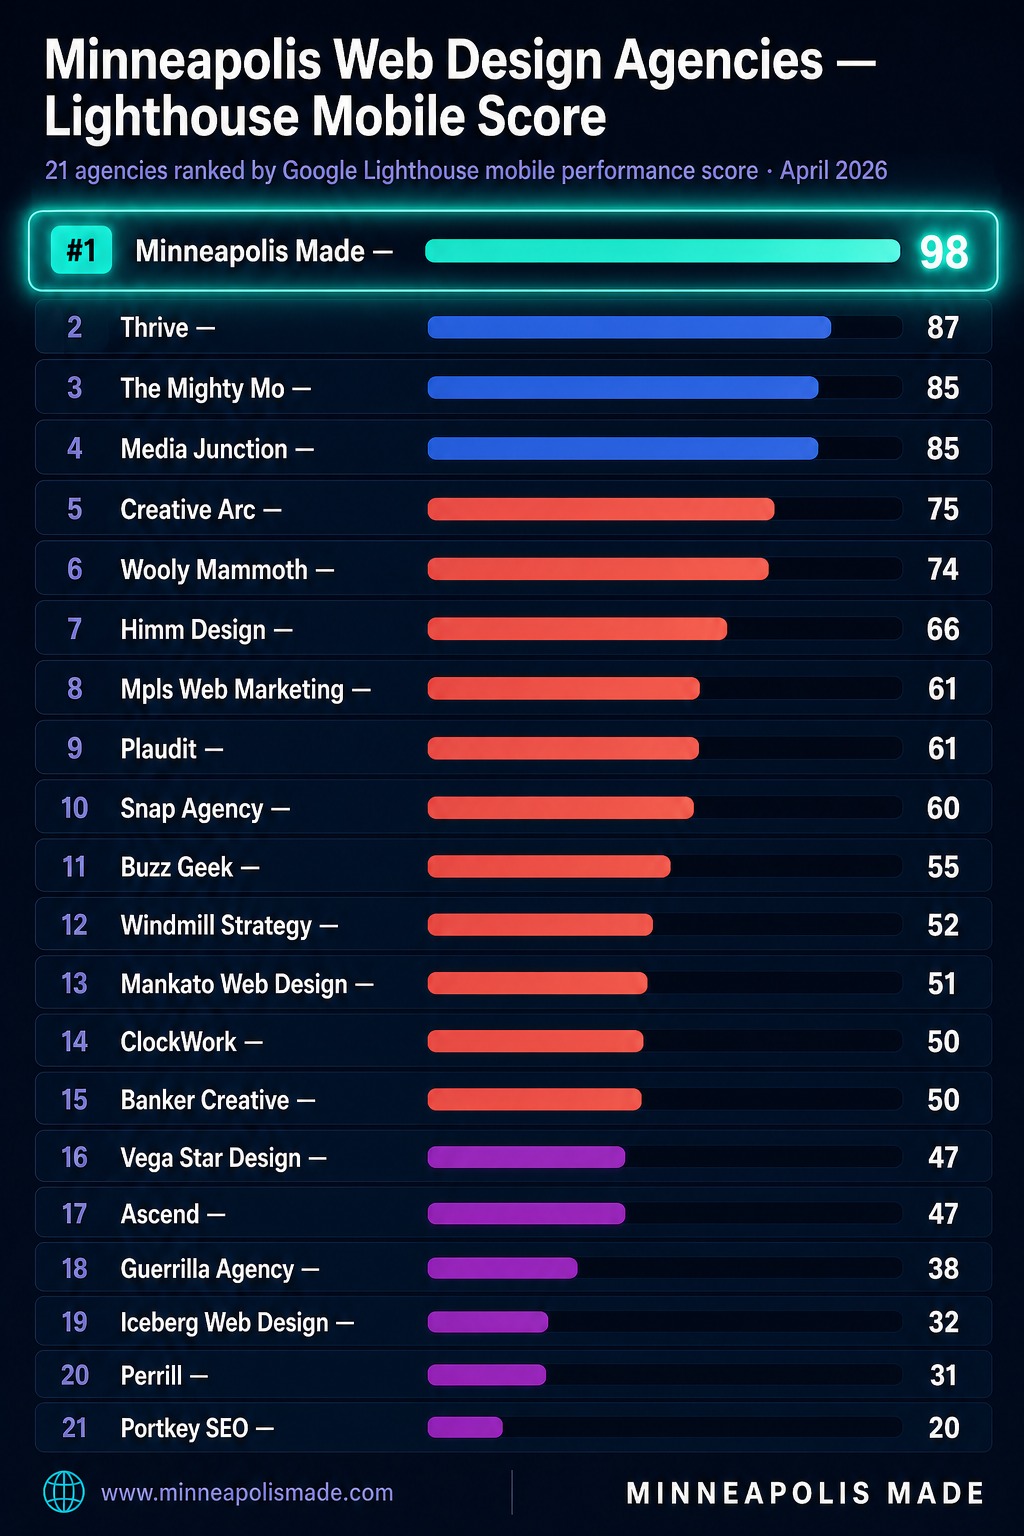
The Full Leaderboard
Sorted by mobile Lighthouse performance score. Green = Google's "fast" range (90-100). Amber = "moderate" (50-89). Coral = "slow" (0-49).
Click Verify on any row to run a fresh Lighthouse test on that agency's site via Google PageSpeed Insights. Don't trust our numbers, check them yourself.
| # | Agency | Mobile | Desktop | LCP | TBT | Verify |
|---|---|---|---|---|---|---|
| 1 | Minneapolis Made #1 | 98 | 100 | 2.2s | 110ms | Verify → |
| 2 | Thrive | 87 | 100 | 2.6s | 424ms | Verify → |
| 3 | The Mighty Mo | 85 | 100 | 2.9s | 418ms | Verify → |
| 4 | Media Junction | 85 | 98 | 3.1s | 160ms | Verify → |
| 5 | Creative Arc | 75 | 88 | 2.6s | 566ms | Verify → |
| 6 | Wooly Mammoth | 74 | 93 | 6.3s | 70ms | Verify → |
| 7 | Himm Design | 66 | 84 | 8.2s | 347ms | Verify → |
| 8 | Mpls Web Marketing | 61 | 97 | 5.8s | 294ms | Verify → |
| 9 | Plaudit | 61 | 77 | 13s | 254ms | Verify → |
| 10 | Snap Agency | 60 | 87 | 3.8s | 784ms | Verify → |
| 11 | Buzz Geek | 55 | 90 | 8.7s | 449ms | Verify → |
| 12 | Windmill Strategy | 52 | 89 | 6.5s | 730ms | Verify → |
| 13 | Mankato Web Design | 51 | 73 | 34.9s | 730ms | Verify → |
| 14 | ClockWork | 50 | 92 | 23.2s | 648ms | Verify → |
| 15 | Banker Creative | 50 | , | 13.1s | 535ms | Verify → |
| 16 | Ascend | 47 | 91 | 7.6s | 999ms | Verify → |
| 17 | Vega Star Design | 47 | 87 | 5.8s | 516ms | Verify → |
| 18 | Guerrilla Agency | 38 | 71 | 23.3s | 1132ms | Verify → |
| 19 | Iceberg Web Design | 32 | 63 | 32.9s | 873ms | Verify → |
| 20 | Perrill | 31 | 70 | 22.3s | 1552ms | Verify → |
| 21 | Portkey SEO | 20 | 60 | 32.1s | 861ms | Verify → |
“If this is what they ship for themselves,
what will they ship for you?”
Speed is the one thing a prospect can verify in 30 seconds, and 17 of 21 agencies failed it.
What a slow site actually costs
Site speed isn't a vanity metric. It controls how many visitors stay long enough to become customers, and how Google ranks you in local search.
When 16 of the 21 agencies selling Minneapolis web design services can't pass Core Web Vitals on their own websites, it's fair to ask whether they can deliver performance for clients either.
Why a slow site quietly bleeds revenue
Every second a visitor waits is a decision they're making about whether you're worth their time. Before a headline registers, before a testimonial loads, the loading spinner has already made the first impression for you, and usually it's a bad one.
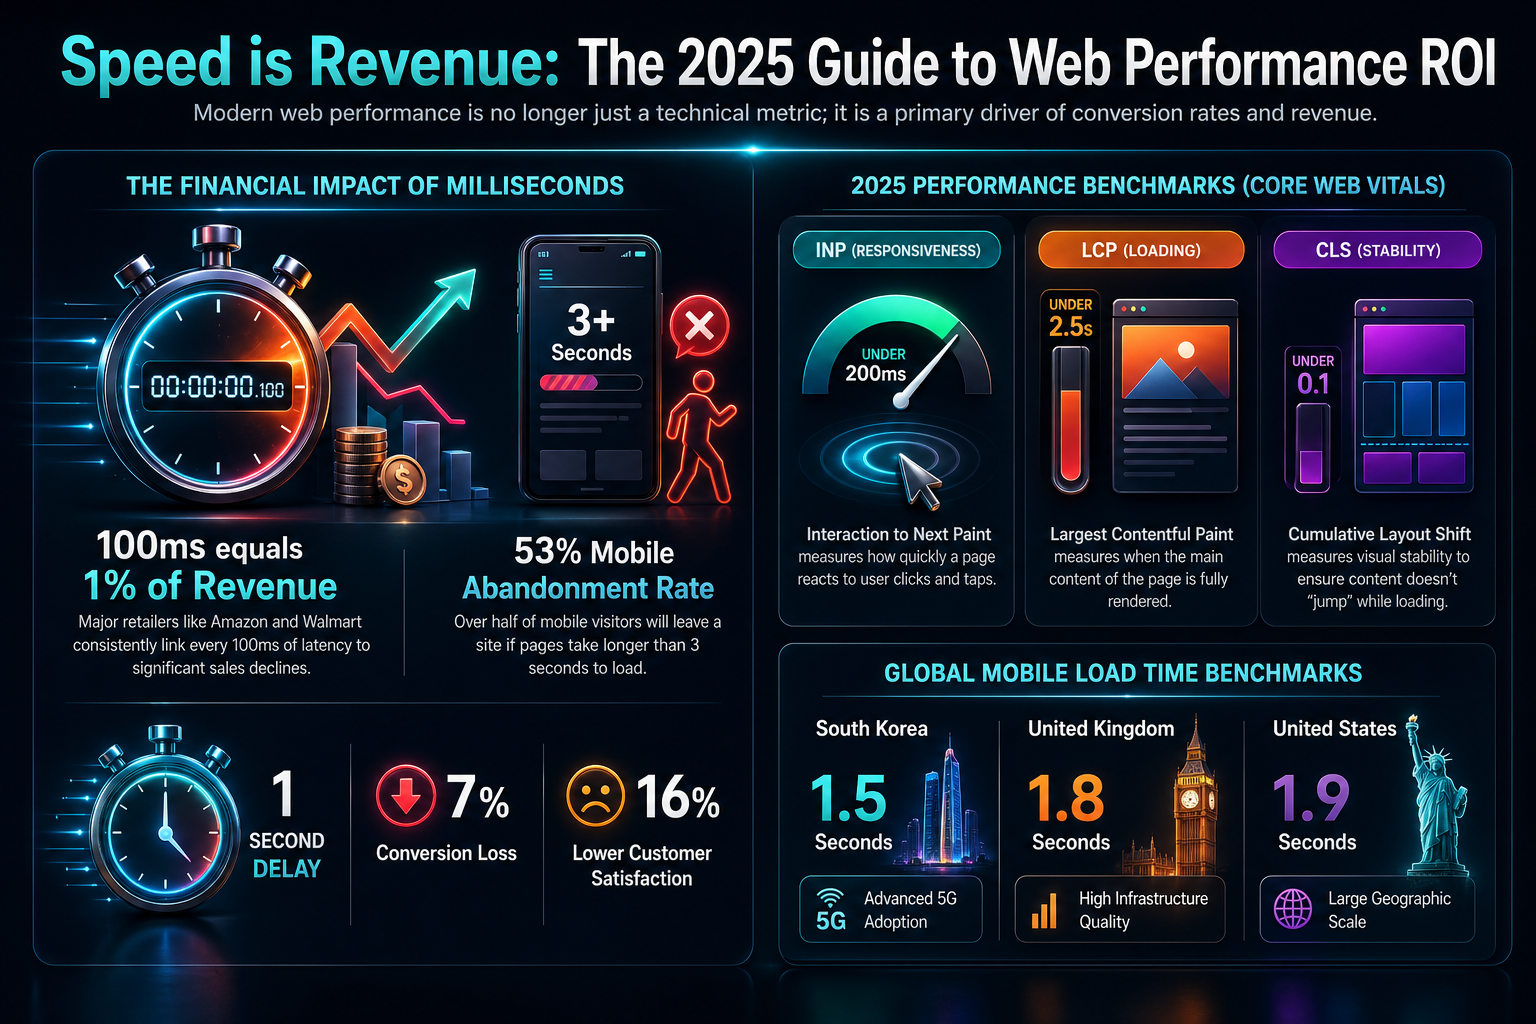
The cost stacks in three places at once. First, ad budget: if you're paying Google or Meta for clicks and 30% of them bounce before your page renders, you just paid for traffic you never got to talk to. Second, organic visibility: Google uses Core Web Vitals as a ranking signal, so failing sites get nudged down the results page for every search where a competitor passes. Third, trust: slow loads read as "small operation, probably outdated" to a visitor comparing three agencies on one tab.
The silver lining: speed is one of the few marketing variables you can fix once and collect on forever. A redesigned, well-optimized site doesn't need an ongoing media spend to keep paying back. It compounds.
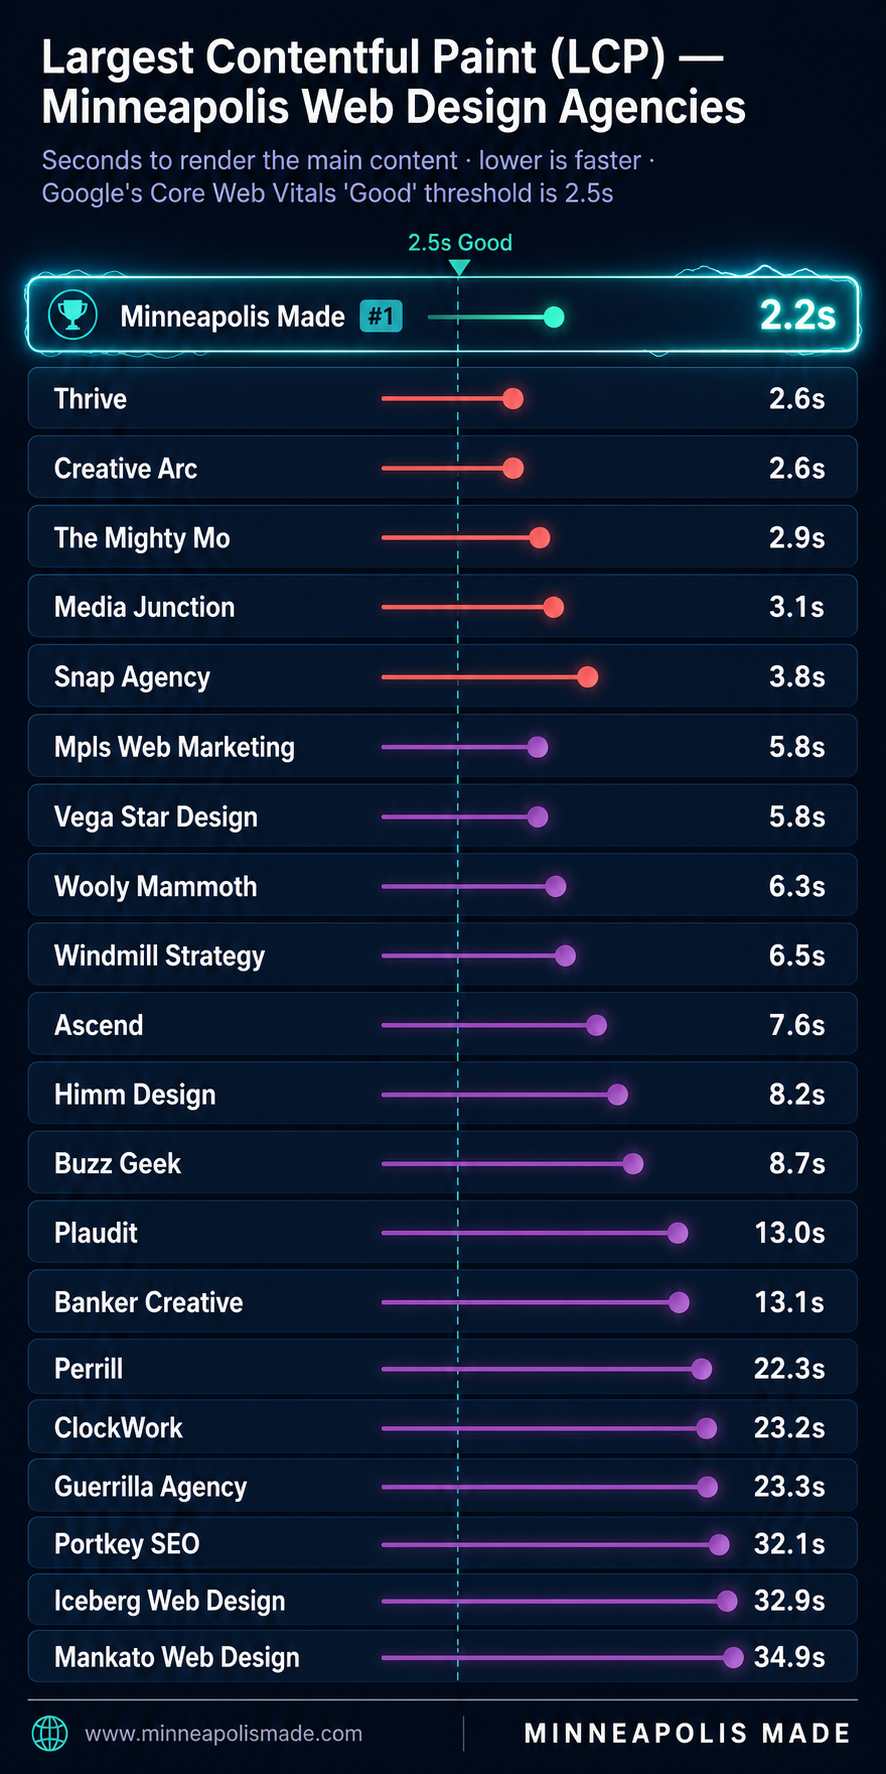
Largest Contentful Paint
LCP measures how fast the main visual content loads. Google considers under 2.5 seconds "good" and over 4 seconds "poor." In our benchmark, only 1 of 21 agencies hit the good threshold on mobile. Six exceeded 20 seconds.
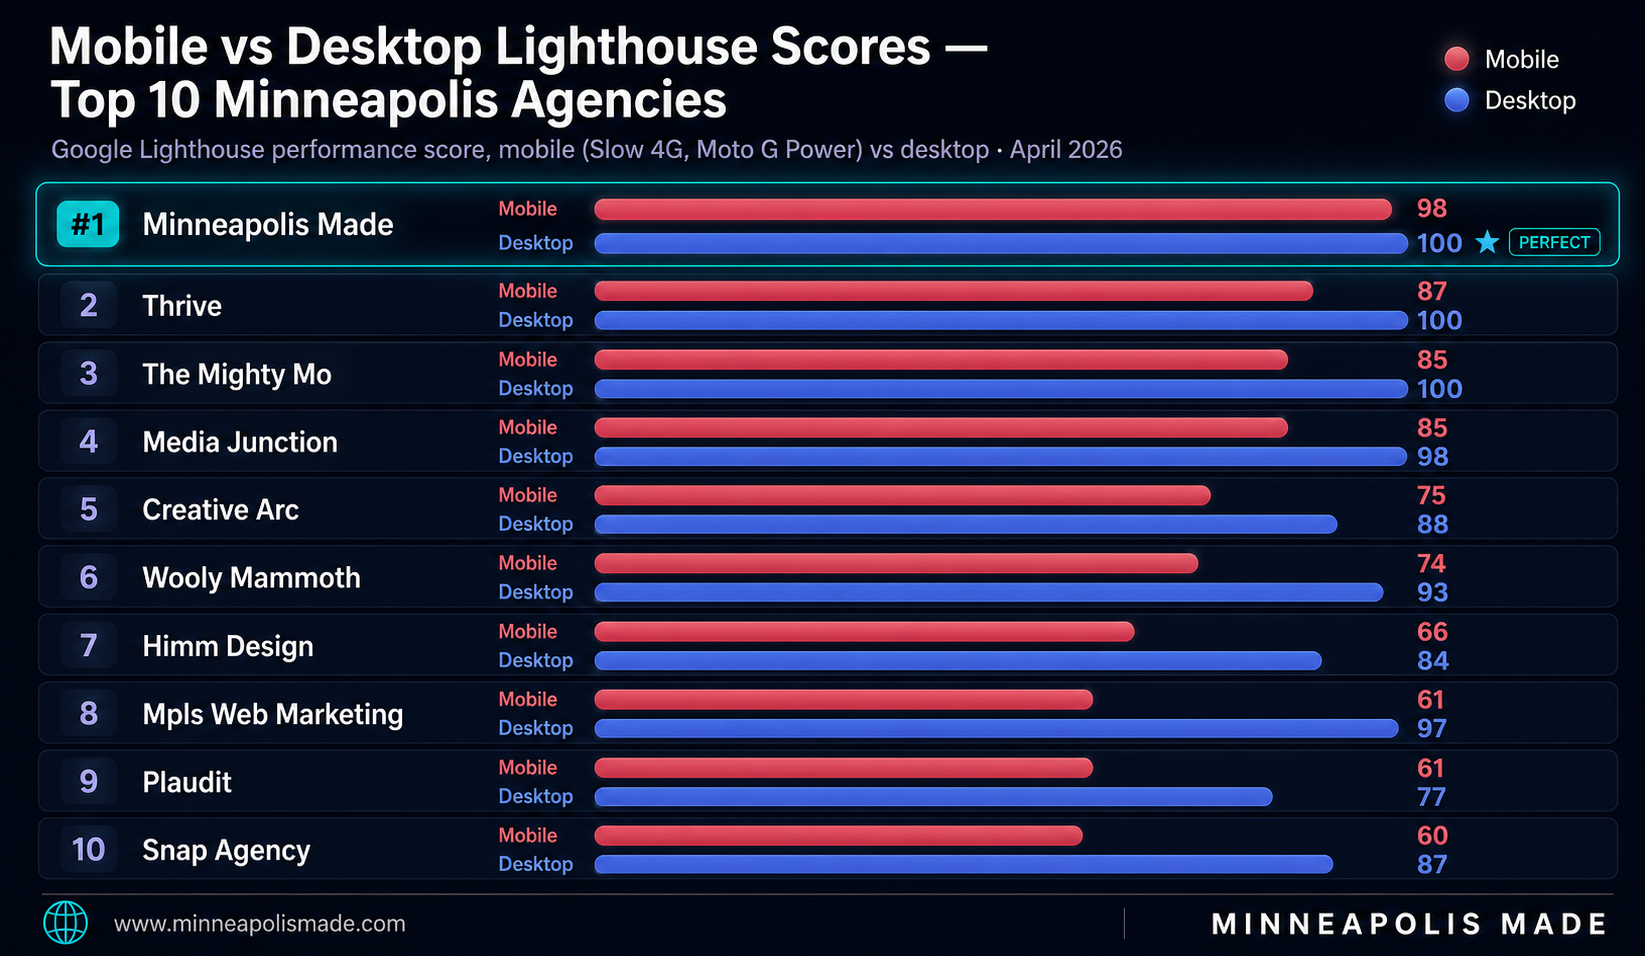
Mobile is where Google actually ranks
Half the agencies we tested score respectably on desktop but collapse on mobile. Google has used mobile-first indexing for every site since 2024, so desktop scores are irrelevant for ranking. This chart shows the gap.
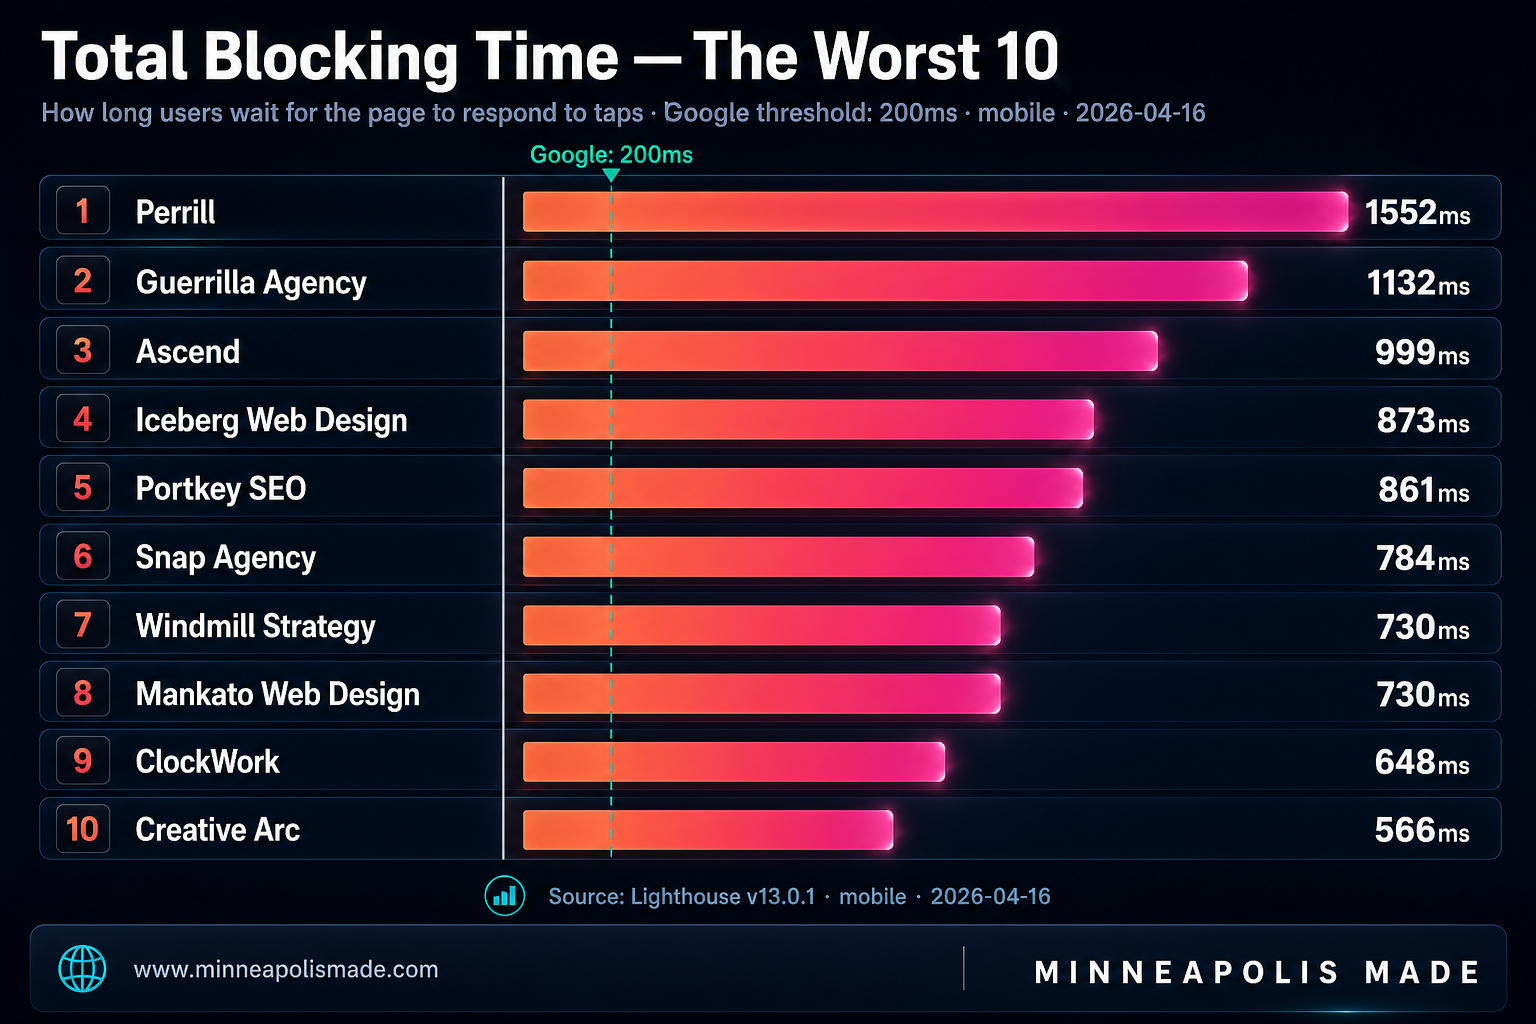
Total Blocking Time, the tap-and-wait metric
TBT measures how long the page is frozen and unresponsive to user interaction. Google's threshold is 200 milliseconds. Ten of the agencies we tested exceeded 500ms. Two exceeded one full second of blocking time.
Why Minneapolis Made ranks #1
We practice what we sell. The same techniques we use for client web development are visible in every byte of this one:
- Self-hosted fonts served as woff2 with latin-only subsets, no Google Fonts round-trip
- Inline SVG icons instead of a 30KB Iconify runtime + API calls
- LiteSpeed page cache at the web server level, near-zero TTFB
- WebP images with automatic content negotiation via .htaccess
- Deferred analytics via requestIdleCallback, off the LCP critical path
- Conditional CSS, blog pages ship 73% less inline CSS than service pages
This site scored 98 mobile, 100 desktop (perfect score), 2.2s LCP, 110ms TBT, 0 CLS in our latest Lighthouse run. Baseline benchmark (2026-04-17 morning, used to test competitors) measured 95 mobile and 2.3s LCP; the afternoon re-test after the Cloudflare + WebGL defer tuning landed at today's figures. Desktop went from 97 pre-Cloudflare to a perfect 100.
Want to know your own site's score?
We'll run the same Lighthouse audit on your current site, compare your scores to the leaderboard above, and give you a prioritized list of what to fix. No sales pitch.
Frequently Asked Questions
Why does site speed matter for local SEO?
Google uses Core Web Vitals as a ranking signal since 2021. Mobile speed directly impacts bounce rate, a site that takes 3 seconds to load loses 32% of visitors before they see any content.
What counts as a good Lighthouse mobile score?
Google considers 90-100 fast, 50-89 moderate, 0-49 slow. Mobile is what matters, Google has used mobile-first indexing since 2019. Only 4 of 21 tested Minneapolis agencies scored 80+ on mobile.
How was this benchmark tested?
Lighthouse v13.0.1 on mobile (emulated Moto G Power, slow 4G) and desktop. Tested 2026-04-16. Median score reported per site. Raw data available on request.
Will my agency be added to the report?
We re-run the benchmark quarterly with additional Minneapolis and St. Paul agencies. Email hello@minneapolismade.com to nominate a site. Inclusion is editorial and non-pay-to-play.
What is the difference between LCP and TBT?
LCP measures when the main content visibly renders. TBT measures how long the page is frozen and unresponsive. Both matter: LCP controls whether a user sees your content; TBT controls whether they can interact with it.
How often is this report updated?
Quarterly. Next scheduled update: 2026-07-16. Historical results are archived with date stamps.
Hire the agency that ranks #1 on its own leaderboard
We've built and optimized Minneapolis websites for 30 years. Same team, same techniques, same results, verified by the data on this page.