
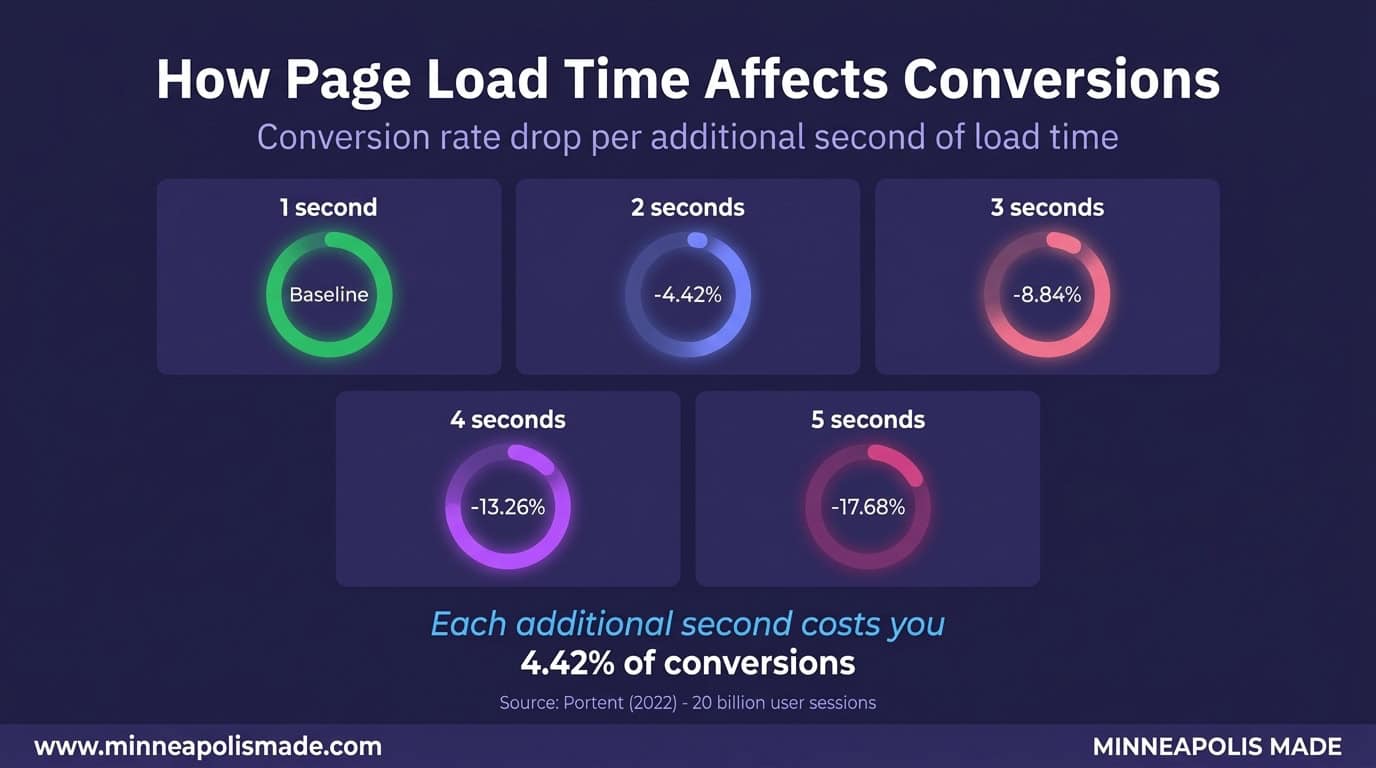
Website speed optimization isn’t a nice-to-have. It’s a revenue lever. According to Portent (2022), conversion rates drop by an average of 4.42% with each additional second of load time. For a Minneapolis business generating $50,000 a month in online revenue, that’s $2,210 gone every month from a single extra second of load time. Over a year, that’s $26,520 in lost sales because your site couldn’t keep up.
We’ve optimized site speed for dozens of Twin Cities businesses, from e-commerce stores to service companies. The pattern is always the same: fix the speed, watch the numbers climb. This guide covers what slow actually costs, what causes it, and how to fix it without a complete rebuild.
Key Takeaways
- Each additional second of load time reduces conversions by 4.42% on average (Portent, 2022)
- 53% of mobile visitors abandon sites that take more than 3 seconds to load (Google, 2023)
- Core Web Vitals are now a confirmed Google ranking factor, with LCP under 2.5 seconds as the target
- Four basic fixes (image compression, lazy loading, caching, plugin cleanup) typically improve load time by 40-60%
How Much Revenue Does a Slow Website Actually Cost?
A one-second delay in page load time reduces conversions by 4.42%, according to Portent’s 2022 study of 20 billion user sessions. That’s not a rounding error. For an e-commerce site converting at 2.5% with 10,000 monthly visitors and a $75 average order value, one extra second of load time costs roughly $830 per month in lost sales.
The damage compounds as pages get slower. Google’s own research (2023) found that 53% of mobile site visits are abandoned if a page takes longer than 3 seconds to load. That’s more than half your mobile traffic walking away before they see your homepage.
Think about what that means for a local business. A Minneapolis restaurant with an online ordering system losing 53% of mobile visitors isn’t just losing clicks. They’re losing dinner orders. A law firm whose intake form takes 5 seconds to load isn’t losing page views. They’re losing clients to the firm down the street whose site loads in under 2.
Personal Experience
We’ve seen this play out repeatedly with Twin Cities clients. One e-commerce client came to us with a 6.8-second load time and a 1.1% conversion rate. After optimizing their site to 2.1 seconds, their conversion rate jumped to 2.8%. Same traffic, same products, same prices. Speed was the only variable.
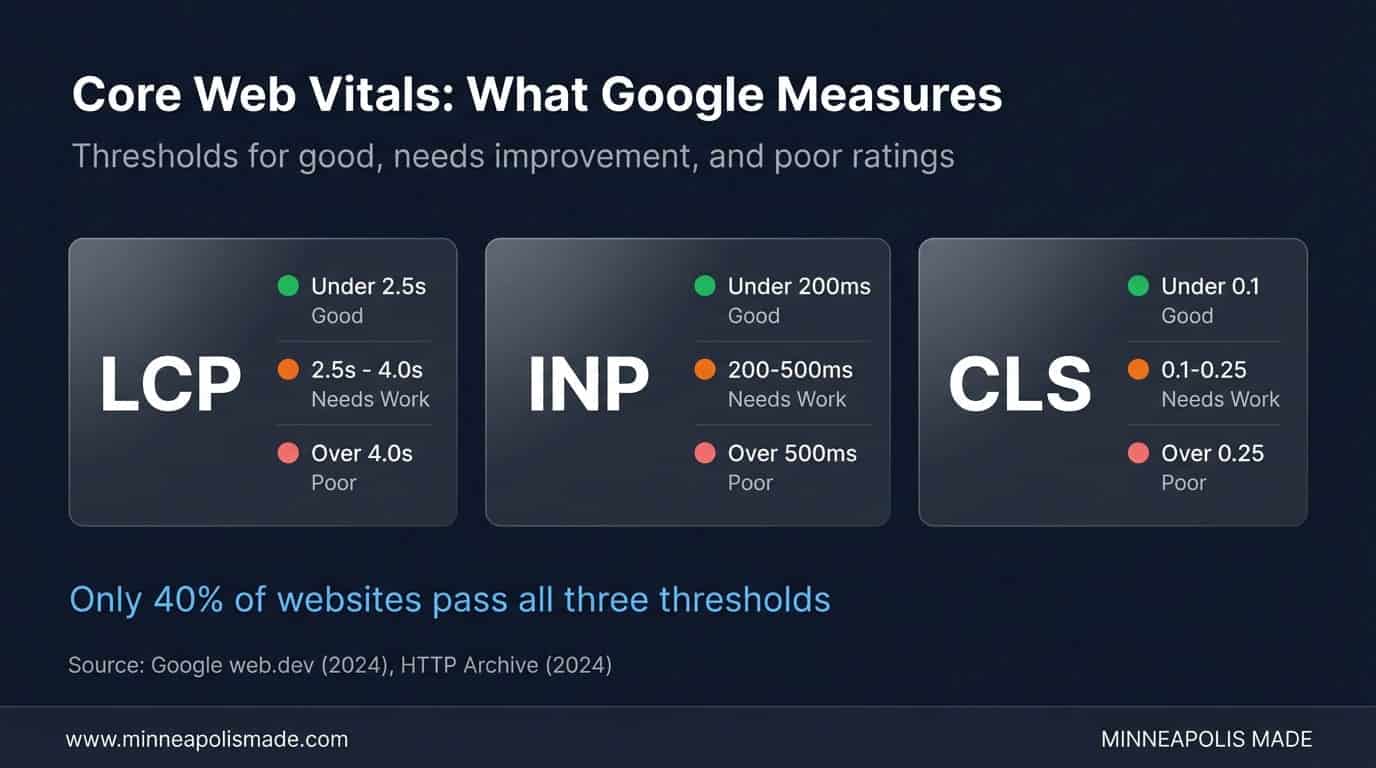
What Are Core Web Vitals, and Why Do They Matter for Rankings?
Core Web Vitals became a confirmed Google ranking factor in 2021, and the metrics have been updated since. According to Google’s web.dev documentation (2024), the three metrics that matter are LCP (Largest Contentful Paint), INP (Interaction to Next Paint, which replaced FID in March 2024), and CLS (Cumulative Layout Shift). Sites that pass all three get a ranking boost in mobile search results.
Here’s what “good” looks like for each metric:
- LCP (Largest Contentful Paint): Under 2.5 seconds. This measures how long it takes for the largest visible element (usually a hero image or heading) to render. Over 4 seconds is “poor.”
- INP (Interaction to Next Paint): Under 200 milliseconds. This replaced FID in March 2024 and measures how quickly the page responds when a user clicks, taps, or types. Over 500ms is “poor.”
- CLS (Cumulative Layout Shift): Under 0.1. This measures how much the page layout shifts while loading. Images without dimensions, late-loading ads, and dynamically injected content cause high CLS.
According to the HTTP Archive’s Web Almanac (2024), only about 40% of websites pass all three Core Web Vitals thresholds. That means 60% of the web is leaving ranking potential on the table. For competitive local keywords in Minneapolis, passing CWV when your competitors don’t is a real edge.
Related: AI Content Creation: Why Hybrid Workflows Beat Pure AI
What Makes Websites Slow in the First Place?
Images account for roughly 50% of total page weight on the average website, according to the HTTP Archive (2024). That makes unoptimized images the single biggest contributor to slow load times. A 3MB hero image that could be a 150KB WebP file is adding 2-3 seconds to your LCP for zero visual benefit.
But images aren’t the only problem. Here are the usual suspects we find when auditing Minneapolis business sites:
Too Many Plugins (WordPress Sites)
The average WordPress site has 20+ active plugins. Each one adds HTTP requests, CSS files, and JavaScript that the browser has to download and process. We’ve seen sites where deactivating 8 unused plugins cut load time by 1.5 seconds instantly. That’s not optimization. That’s just cleanup.
No Caching Strategy
Without browser caching and server-side caching, every page visit forces the server to rebuild the page from scratch. Adding a caching layer (WP Super Cache, W3 Total Cache, or server-level caching via LiteSpeed or Nginx) can reduce Time to First Byte from 800ms to under 200ms.
Render-Blocking JavaScript and CSS
Third-party scripts (analytics, chat widgets, social embeds, ad trackers) load synchronously by default, blocking the page from rendering until they finish. Moving these to async or defer loading, or removing ones you’re not actively using, is one of the fastest LCP improvements available.
Cheap Shared Hosting
There’s a reason $3/month hosting is $3/month. Shared hosting means your site shares CPU, RAM, and bandwidth with hundreds of other sites. When your neighbor’s site gets a traffic spike, yours slows down. For any business that depends on its website for revenue, managed hosting ($30-$100/month) pays for itself in the first week.
Original Data
In our audits of Minneapolis business websites, the top three speed killers are consistently: oversized images (found in 85% of audits), excessive WordPress plugins (70%), and missing server-side caching (65%). Fixing just these three typically gets a site from “poor” to “good” on Core Web Vitals.
Related: WooCommerce vs Shopify: Which Platform Wins for Minneapolis Retailers?
How Does Page Speed Affect Mobile Users Specifically?
Mobile traffic now accounts for over 60% of all web traffic globally, according to Statcounter (2025). And mobile users are less patient. Google’s research confirms that 53% of mobile visits are abandoned if a page takes longer than 3 seconds to load.
The problem compounds because mobile networks are slower and mobile devices have less processing power. A page that loads in 2 seconds on your office desktop might take 5 seconds on a phone over LTE. Your site feels fast to you because you’re testing it on a wired connection with a fast laptop. Your customers are experiencing something very different.
Google also uses mobile-first indexing, meaning the mobile version of your site is what gets evaluated for rankings. If your desktop site is fast but your mobile site is slow, your rankings will reflect the mobile experience.
Unique Insight
Most business owners test their site speed from their office, on a fast Wi-Fi connection, on a new laptop. That’s not how their customers experience it. We always test with Chrome DevTools throttled to “Slow 4G” and a mid-range Android device profile. The results are often sobering. Try it yourself before assuming your site is “fast enough.”
What Are the Fastest Website Speed Fixes?
You don’t need a complete rebuild to see results. According to our work with Twin Cities businesses, these four fixes address 80% of speed problems and can usually be done in a single afternoon:
1. Compress and Convert Images
Convert all images to WebP format. Use srcset for responsive sizes. Compress to 80% quality. Most visitors can’t tell the difference between 80% and 100% quality, but the file size drops by 60-70%. Tools like ShortPixel or Imagify can automate this for WordPress sites.
2. Implement Lazy Loading
Add loading="lazy" to every image below the fold. This tells the browser to only load images when they’re about to scroll into view. For a page with 15 images, this can cut initial page weight by 70% or more. The hero image should NOT be lazy loaded. Give it fetchpriority="high" instead.
3. Enable Server-Side Caching
Install a caching plugin or enable server-level caching through your host. This serves pre-built HTML pages instead of generating them on every request. Time to First Byte typically drops from 500-800ms to 50-150ms. If your host doesn’t support server-level caching, it might be time to switch hosts.
4. Audit and Remove Unused Plugins
Deactivate every plugin you’re not actively using. Then deactivate plugins one at a time and test load speed after each. You’ll often find 2-3 plugins that account for most of the JavaScript bloat. Replace heavyweight plugins with lighter alternatives where possible.
Related: How to Choose a Web Development Agency
When Should You Hire a Professional for Speed Optimization?
If your site scores below 50 on Google PageSpeed Insights after the four quick fixes above, you likely have deeper issues. Custom theme optimization, database query tuning, JavaScript refactoring, and CDN configuration require development expertise. These aren’t plugin-install fixes.
Signs you need professional help:
- Core Web Vitals all show “poor” (red) in Google Search Console
- PageSpeed Insights score is below 40 on mobile
- Time to First Byte exceeds 600ms consistently
- Your site uses a page builder (Elementor, Divi, WPBakery) and loads slowly even with caching
- You’ve installed 3+ “speed optimization” plugins and your site is still slow
Personal Experience
Page builder sites are our most common speed optimization projects. Elementor and Divi generate enormous CSS and JavaScript output. Sometimes the right move is to keep the builder and optimize around it. Sometimes the right move is to rebuild the critical pages as custom templates. We’ve done both for Minneapolis businesses, and the answer depends on budget and how many pages need to be fast.
Want to know exactly what’s slowing your site down?
We’ll run a full Core Web Vitals audit, identify the top 5 speed killers, and give you a prioritized fix list. Most sites have at least 3 quick wins hiding in plain sight.
How Do You Measure Website Speed Correctly?
Don’t just load your site and eyeball it. Use these tools to get real data:
- Google PageSpeed Insights: Shows both lab data (simulated) and field data (from real Chrome users). Field data matters more for rankings.
- Google Search Console: The Core Web Vitals report shows how Google sees your pages. Green = good, yellow = needs improvement, red = poor.
- WebPageTest: Advanced testing with filmstrip view, waterfall charts, and multi-location testing. Set the connection speed to “4G” for realistic mobile results.
- Chrome DevTools: Press F12, go to the Performance tab, and throttle to “Slow 4G” to see what your mobile visitors experience.
Test from multiple locations if your customers are spread across Minnesota or the Midwest. A site hosted in Virginia will be slower for Minneapolis users than one hosted in Chicago or on a CDN with Midwest edge nodes.
Related: Web development services focused on performance
Related: Managed services to keep your site fast and secure
Related: Core Web Vitals explained: how Google measures your site speed
Related: When a slow site means it is time for a redesign
Related: We tested 21 Minneapolis agencies on speed: only 5 passed Core Web Vitals
Frequently Asked Questions
What is a good page load time for a website?
Under 2.5 seconds for Largest Contentful Paint is Google’s “good” threshold. Under 1.5 seconds is excellent. According to Portent (2022), the highest e-commerce conversion rates occur at load times between 0 and 2 seconds, with rates dropping significantly after the 2-second mark.
Does page speed really affect Google rankings?
Yes. Core Web Vitals have been a confirmed ranking factor since June 2021. Google uses field data from real Chrome users (CrUX data) to assess page experience. Sites that fail CWV don’t get a penalty per se, but they miss out on the ranking boost that passing sites receive. In competitive local markets like Minneapolis, that boost can mean the difference between position 3 and position 8.
How much does website speed optimization cost?
Basic optimization (image compression, caching, plugin cleanup) can be done for free with the right tools and knowledge. Professional speed optimization for WordPress sites typically costs $500 to $2,500 depending on complexity. For sites built on page builders like Elementor or Divi, expect the higher end of that range. The ROI is usually positive within the first month from improved conversion rates.
Is my slow website caused by my hosting provider?
Possibly. If your Time to First Byte (TTFB) consistently exceeds 600ms, hosting is likely a factor. Shared hosting plans ($3-$10/month) pack hundreds of sites on one server. Managed WordPress hosting ($30-$100/month) typically delivers TTFB under 200ms. Check your TTFB at WebPageTest.org before blaming your code.
Will switching to a CDN make my site faster?
For geographically distributed audiences, yes. A CDN (Content Delivery Network) serves your static files from edge servers close to the visitor. For a Minneapolis business serving mostly Twin Cities customers, a CDN helps less than optimizing server location. But if you serve clients across the Midwest or nationally, a CDN like Cloudflare (free tier available) or BunnyCDN can cut load times by 30-50% for distant visitors.