More than half of your potential customers won’t wait for your website to load. According to Google, 53% of mobile visitors leave a site that takes longer than 3 seconds. Core Web Vitals are Google’s way of measuring whether your site is fast enough, responsive enough, and stable enough to keep those visitors around. If you run a business in Minneapolis, these three metrics directly affect your search rankings, your conversion rates, and ultimately your revenue.
Related: The Real Cost of a Slow Website for Minneapolis Businesses
Key Takeaways
- Core Web Vitals measure three things: loading speed (LCP), responsiveness (INP), and visual stability (CLS)
- A 0.1-second speed improvement can boost retail conversions by 8.4% (Deloitte/Google)
- INP replaced FID as a Core Web Vital in March 2024, raising the bar for interactivity
- WordPress powers 43.5% of all websites, and hosting quality is the biggest performance bottleneck
- Free tools like PageSpeed Insights and Search Console let you test your scores in minutes
What Are Core Web Vitals and Why Do They Matter?
Core Web Vitals became a Google ranking factor in June 2021, and the program was updated in March 2024 when Interaction to Next Paint (INP) replaced First Input Delay (FID) as the responsiveness metric (Google web.dev). These three metrics give Google a standardized way to evaluate real-world user experience on every page of your site.
The three Core Web Vitals are Largest Contentful Paint (LCP), Interaction to Next Paint (INP), and Cumulative Layout Shift (CLS). Each measures a different dimension of user experience. LCP tracks loading performance. INP tracks responsiveness. CLS tracks visual stability. Together, they answer a simple question: does your website feel fast and reliable to the people using it?
Google categorizes each metric into three zones: Good, Needs Improvement, and Poor. Sites that pass all three metrics in the Good range get a small ranking boost. More importantly, they keep visitors on the page. Pages that fail these thresholds see higher bounce rates and fewer conversions. It’s not just about Google’s algorithm. It’s about whether real people have a frustrating experience on your site.
Related: Complete Guide to Web Design in Minneapolis
What Is LCP and How Do You Fix It?
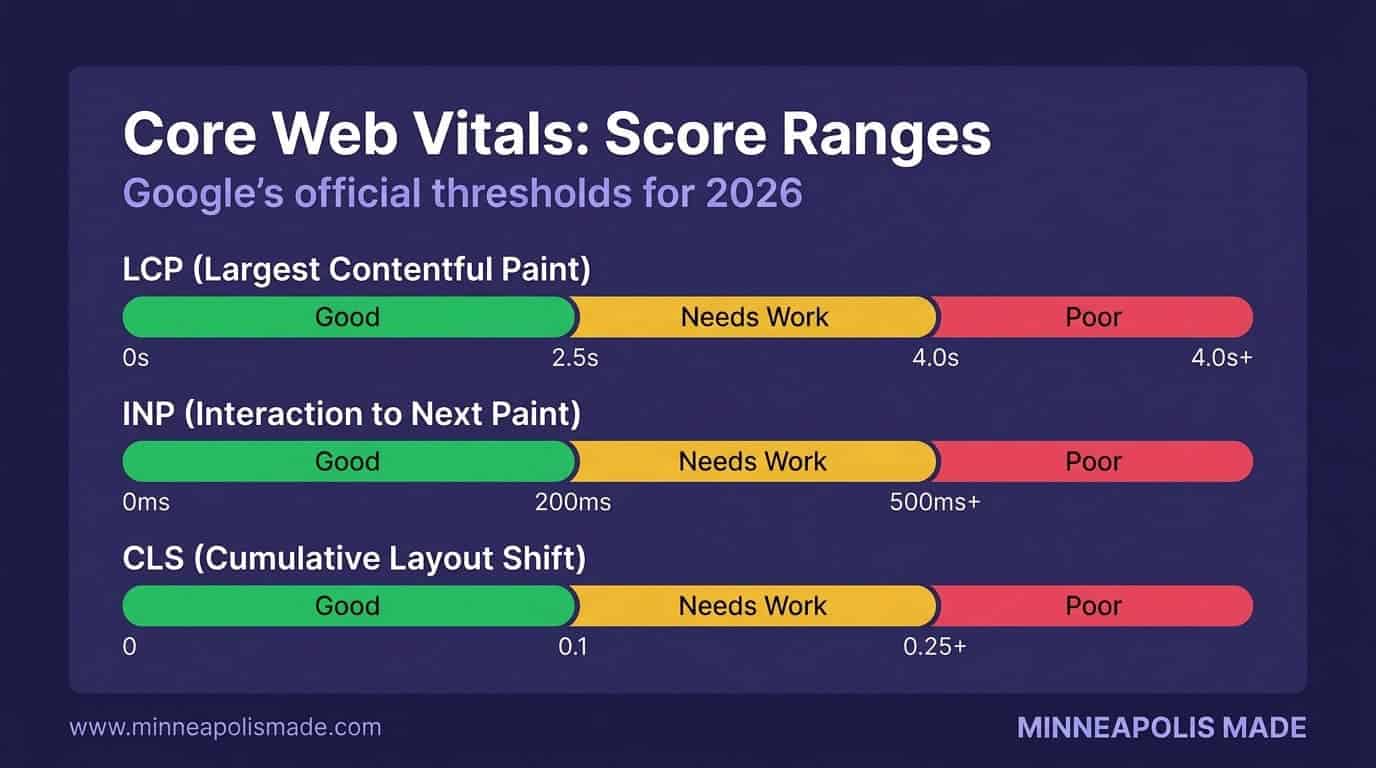
Good LCP is under 2.5 seconds according to Google’s official documentation. Anything between 2.5 and 4 seconds needs improvement, and anything over 4 seconds is rated poor. LCP measures how long it takes for the largest visible element on your page to fully render, whether that’s a hero image, a headline, or a video thumbnail.
Why does LCP matter so much? Because it’s the metric that correlates most closely with a user’s perception of page speed. People don’t time your server response with a stopwatch. They notice when the main content takes forever to appear. A slow LCP means your visitors are staring at a blank or half-loaded screen.
Common Causes of Slow LCP
Large, unoptimized images are the most frequent culprit. A 3 MB hero image that hasn’t been compressed or converted to a modern format will tank your LCP score every time. Slow server response time (also called Time to First Byte) is the second most common cause, especially on shared hosting plans.
Render-blocking CSS and JavaScript also delay LCP. If your browser has to download and parse three large stylesheets and five JavaScript files before it can paint anything on screen, your largest element won’t appear until all that work is done.
How to Fix LCP
Start with images. Convert to WebP or AVIF format, compress aggressively, and use responsive srcset attributes so mobile devices don’t download desktop-sized files. Preload your LCP element using <link rel="preload"> so the browser fetches it early.
Upgrade your hosting if Time to First Byte is over 600 milliseconds. Shared hosting plans from GoDaddy or Bluehost often can’t deliver fast TTFB under real traffic. Managed WordPress hosts like WP Engine or Kinsta typically cut TTFB in half.
Finally, minimize render-blocking resources. Inline critical CSS, defer non-essential stylesheets, and move JavaScript to the bottom of the page or load it with the defer attribute.
What Is INP and Why Did It Replace FID?
INP replaced FID as a Core Web Vital in March 2024 because FID only measured the delay of a user’s first interaction (Google web.dev). INP measures responsiveness across every interaction during the entire page visit, from clicks and taps to keyboard inputs. A good INP score is under 200 milliseconds.
Think of it this way. FID was like grading a restaurant only on how fast the host seats you. INP grades every interaction: how fast your food arrives, how quickly the server responds when you ask for the check, and everything in between. It’s a much more honest measure of how responsive your site actually feels.
What Causes Poor INP Scores?
Heavy JavaScript is the primary offender. When the browser’s main thread is busy executing a long JavaScript task, it can’t respond to user input. The click or tap gets queued, and the user experiences a noticeable delay. Third-party scripts, like chat widgets, analytics tools, and ad networks, make this worse by competing for processing time.
Complex DOM structures also hurt INP. If your page has thousands of elements, the browser takes longer to process layout and paint changes after each interaction. WordPress sites loaded with page builder plugins are particularly vulnerable here.
How to Fix INP
Defer non-critical JavaScript. Your cookie consent banner and live chat widget don’t need to load before the page is interactive. Use defer or async attributes, and consider loading third-party scripts only after user interaction.
Break up long tasks using requestIdleCallback or setTimeout to yield back to the main thread. Code splitting, where you only load the JavaScript needed for the current page, can dramatically reduce main thread work.
Audit your third-party scripts ruthlessly. We’ve seen Minneapolis business sites running 15 or more third-party scripts that collectively add 2–3 seconds of main thread blocking time. Remove what you don’t need.
What Is CLS and Why Does Your Layout Keep Jumping?
A good CLS score is under 0.1 according to Google’s thresholds, and anything above 0.25 is rated poor (Google web.dev). CLS measures visual stability by quantifying how much your page layout shifts unexpectedly while it loads. You’ve experienced bad CLS if you’ve ever tried to tap a button and the page jumped, causing you to click the wrong thing.
CLS doesn’t penalize all layout shifts. Only unexpected shifts count. If a user clicks a button and a dropdown appears, that’s expected. If an ad loads two seconds after the page and shoves the content down, that’s an unexpected shift and it hurts your score.
Common Causes of Layout Shift
Images and videos without explicit width and height attributes are the biggest offenders. Without dimensions, the browser doesn’t know how much space to reserve, so the layout reflows once the media loads. Late-loading web fonts cause text to resize and shift when the custom font finally replaces the fallback. Dynamically injected content, like ad banners or newsletter popups, pushes existing content around.
How to Fix CLS
Always set width and height attributes on images and videos. Modern browsers use these to calculate the aspect ratio and reserve space before the asset loads. For responsive images, CSS aspect-ratio works well too.
Use font-display: swap in your @font-face declarations, and consider preloading your most important font files. This prevents the invisible text flash and reduces the layout shift when fonts swap in.
Reserve explicit space for any dynamic content. If you have an ad slot that’s 250 pixels tall, set a min-height on its container. Same for embeds, iframes, and any content loaded after initial render.
Not Sure Where Your Core Web Vitals Stand?
We’ll run a full performance audit on your site and show you exactly which metrics need fixing, with a prioritized action plan.
How Does Website Speed Affect Your Minneapolis Business Revenue?
A 0.1-second improvement in mobile site speed boosts retail conversions by 8.4%, according to the Deloitte/Google Milliseconds Make Millions study. That fraction of a second translates into real money. For Minneapolis businesses competing in local search, page speed isn’t a technical nice-to-have. It’s a revenue lever.
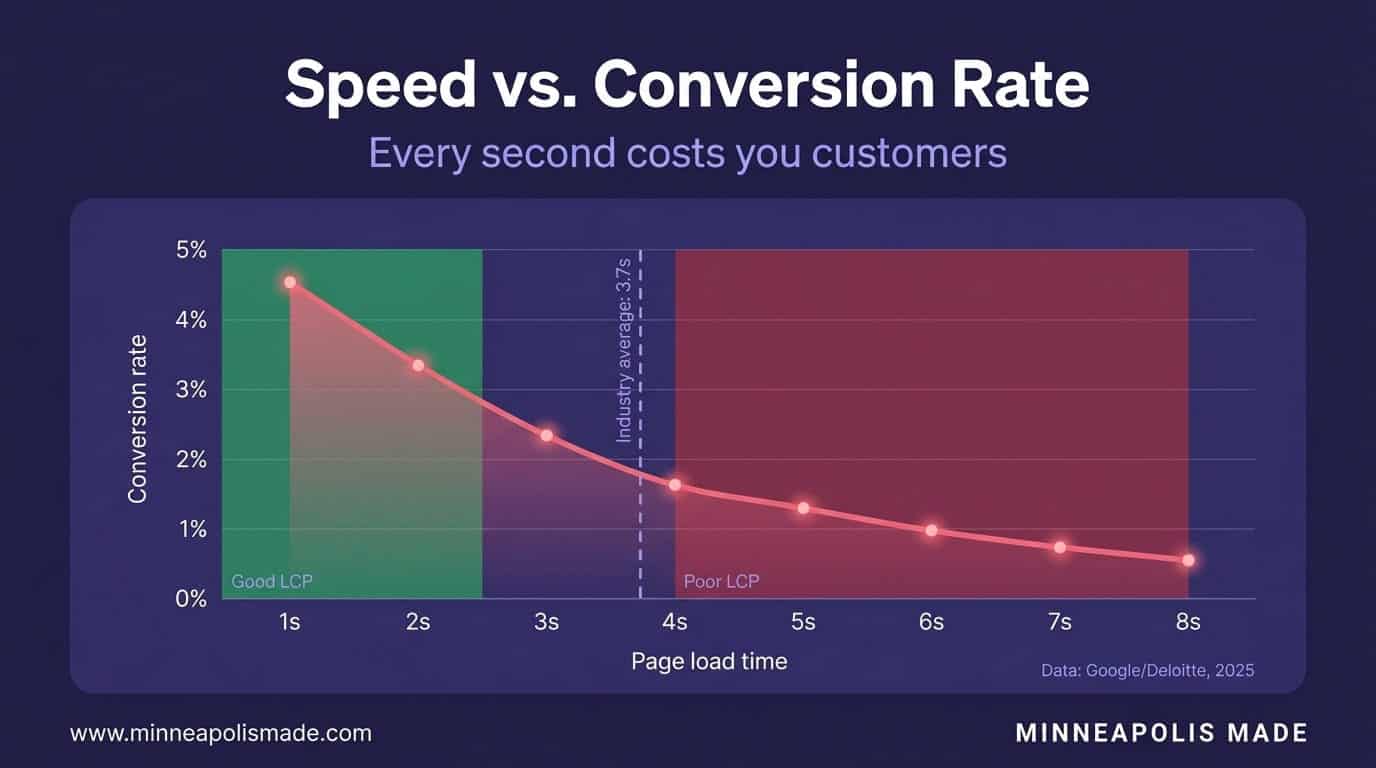
The case studies back this up at scale. Vodafone improved their LCP by 31% and saw an 8% increase in sales (web.dev case studies). Rakuten 24×7 optimized their Core Web Vitals and achieved a 53.37% increase in revenue per visitor (web.dev case studies). These aren’t small startups running A/B tests. These are massive companies measuring the direct impact of performance improvements.
Now bring that down to the local level. If you’re a Minneapolis law firm, restaurant, or home services company spending $2,000–$5,000 per month on Google Ads, every second of unnecessary load time is burning ad budget. A visitor clicks your ad, waits 4 seconds for the page to load, and leaves. You still pay for that click.
Original Data
In our work with Minneapolis small businesses, we’ve consistently seen LCP improvements of 1.2 seconds or more when migrating sites from Wix or Squarespace to a properly optimized WordPress setup on managed hosting. That’s the difference between a 3.8-second LCP (poor) and a 2.6-second LCP (borderline good), often enough to move the needle on both rankings and conversions.
Related: How Much Does Web Design Cost in Minneapolis?
How Do You Test Your Core Web Vitals Right Now?
Google offers free Core Web Vitals data through multiple tools, and the Chrome User Experience Report (CrUX) provides field data from real Chrome users across millions of websites. You don’t need to hire anyone to get a baseline reading. Here’s how to check your scores in under five minutes.
Step 1: Google PageSpeed Insights
Go to pagespeed.web.dev and enter your URL. You’ll get both lab data (simulated test) and field data (real user metrics from CrUX). The field data section shows your actual Core Web Vitals scores. Focus on that section first, because that’s what Google uses for ranking decisions.
Step 2: Chrome DevTools Lighthouse
Open Chrome, press F12, and click the Lighthouse tab. Run a performance audit on mobile. This gives you lab data with specific suggestions for improvement. It won’t match your field data exactly, but it’s useful for diagnosing issues and testing fixes before deploying.
Step 3: Google Search Console
In Google Search Console, navigate to the Core Web Vitals report under Experience. This shows which URLs on your site pass or fail, grouped by issue type. It’s the best way to see your site-wide CWV health at a glance and prioritize which pages to fix first.
Step 4: CrUX Dashboard
The Chrome UX Report dashboard in Google Data Studio lets you track your CWV scores over time. It shows trends for each metric month by month. This is how you measure whether your optimization work is actually moving the needle with real users.
Personal Experience
When we audit Core Web Vitals for Minneapolis client sites, we always check field data in Search Console first, not lab scores. Lab tests run on fast connections with no real-world variability. Field data tells you what your actual customers experience on their phones, on their networks, in their browsers. That’s the number Google cares about, and it’s the number you should care about too.
What’s the Fastest Way to Improve Core Web Vitals for a WordPress Site?
WordPress powers 43.5% of all websites according to W3Techs, and most of them have Core Web Vitals problems. The good news is that WordPress performance issues tend to follow predictable patterns. Here are the highest-impact fixes, ranked by how much they typically improve scores.
1. Switch to Managed WordPress Hosting
Unique Insight
Hosting is the number one bottleneck for most Minneapolis small business WordPress sites, not theme code, not plugins, not images. We’ve seen sites go from a 1.8-second TTFB on shared hosting to 0.3 seconds on managed hosting, with zero code changes. If your TTFB is over 600 milliseconds, don’t waste time optimizing anything else until you fix your hosting.
2. Use a Lightweight Theme
Heavy page builder themes like Divi, Elementor, and Avada add 500 KB–2 MB of CSS and JavaScript to every page load. Switching to a lightweight theme like GeneratePress, Kadence, or a custom theme can cut your total page weight dramatically. Your theme is the foundation. If it’s bloated, everything built on top of it will be slow.
3. Optimize Images
Install an image optimization plugin like ShortPixel or Imagify. Convert images to WebP format automatically, enable lazy loading for images below the fold, and make sure your LCP image (usually the hero) is preloaded, not lazy loaded. This is the single biggest LCP improvement for most sites.
4. Implement Caching
A caching plugin like WP Rocket or LiteSpeed Cache serves pre-built HTML pages instead of running PHP and database queries on every visit. This reduces server response time and improves LCP. Managed hosts like WP Engine include server-level caching, but a plugin adds browser caching and other optimizations.
5. Defer Non-Critical JavaScript
Identify which scripts block the main thread and defer them. WP Rocket’s “Delay JavaScript execution” feature is effective here. Prioritize deferring analytics scripts, chat widgets, social media embeds, and any third-party code that doesn’t need to run immediately.
Related: WordPress Web Design Services in Minneapolis
Related: When Is It Time to Redesign Your Minneapolis Website?
WordPress Site Running Slow? Let’s Fix the Root Cause
We’ll identify your biggest Core Web Vitals bottlenecks and build a prioritized optimization plan tailored to your hosting, theme, and traffic patterns.
Related: SEO services that improve Core Web Vitals rankings
Related: Web development built for speed and performance
Related: SEO vs AEO vs GEO: which strategy drives traffic in 2026?
Related: Local SEO in 2026: how Core Web Vitals affect local rankings
Related: See which Minneapolis agencies actually score well on Core Web Vitals in 2026
Frequently Asked Questions
Do Core Web Vitals directly affect Google rankings?
Yes. Core Web Vitals have been a confirmed Google ranking signal since June 2021. Google uses field data from real Chrome users to evaluate your scores. However, CWV is one of many ranking factors. Great content on a slow site can still rank, but all else being equal, the faster site wins.
What’s the difference between lab data and field data?
Lab data comes from simulated tests (like Lighthouse) run under controlled conditions. Field data comes from real user visits collected through the Chrome User Experience Report. Google uses field data for ranking decisions, so that’s the score that matters most.
How often does Google update Core Web Vitals scores?
Google’s CrUX dataset updates monthly, using a rolling 28-day collection window. After you make performance improvements, expect 4–6 weeks before your field data scores fully reflect the changes in Search Console and PageSpeed Insights.
Can I pass Core Web Vitals on a shared hosting plan?
It’s possible but difficult. Shared hosting often delivers TTFB over 800 milliseconds, which makes hitting a 2.5-second LCP threshold very challenging. If your budget allows, managed WordPress hosting from providers like WP Engine or Kinsta typically delivers TTFB under 400 milliseconds.
Does Wix or Squarespace have good Core Web Vitals?
Both platforms have improved, but neither gives you full control over performance optimization. You can’t defer specific scripts, preload custom resources, or choose your hosting infrastructure. For businesses that need strong CWV scores, a well-optimized WordPress site on managed hosting offers more control.
What should I fix first if all three Core Web Vitals are failing?
Start with LCP, because it’s the most noticeable to users and often the easiest to fix. Image optimization and hosting upgrades alone can solve most LCP issues. Then address CLS (usually quick fixes like adding image dimensions), and tackle INP last since it typically requires JavaScript refactoring.